After working with 50+ D2C companies on acquisition, it’s clear that the strongest ones have a few common characteristics about them.
Over the next series of posts, I’m going to go over the characteristics of each one and introduce a model around them. Actually, they’re more akin to dimensions than characteristics, because there are tension between many of the qualities that make for a strong D2C company.
For example, AOV and CAC (as a percentage of overall LTV) are two different qualities that determine the strength of a D2C’s company’s long term viability. However, there are tensions between the two; as price increases, so does the overall population of customers willing to pay that price. The smaller the population, the higher the marginal cost for each additional customer, and therefore the higher the CAC.
One last thing. I intend for this model to be a more sophisticated way of sizing up D2C companies. Currently, a D2C company’s strength is evaluated based on simplistic measures, like whether or not an item is expensive to ship.
In reality, that doesn’t explain very much. What if an item costs $100 to ship, but the item costs $1k and therefore it’s an overall low percentage based on AOV? What if there’s a huge appetite for these items despite the high price? In this case, “shipping cost” is a pretty crappy metric and we need something more powerful.
Dimension #1: COGS
CAC vs. RoAS
COGS (i.e. Cost of Goods Sold) is the percentage of a unit’s retail price that goes towards its marginal costs, i.e. creating and shipping the item.
When advertisers focus on performance marketing, they typically focus on CAC or RoAS, depending on a few different things that I outline here. In this post, I’ll focus on the strength of D2C companies on the basis of RoAS.
Why? Because modeling based on RoAS allows more flexibility in talking about what a company may be able to do to sell profitably from day 1. Focusing on CAC doesn’t allow this flexibility, because base costs are fixed.
For example, if your average basket size is $50 and on average, an order costs $30 create an produce, an advertiser fixated on CAC (rather than RoAS) would be focused on a maximum CAC of $20.
An advertiser focusing on RoAS, on the other hand, knows that they need a RoAS of at least 2.5x. This means that they also have the ability to increase AOV at their disposal, something made much easier to do with Facebook’s new tools around RoAS maximization.
Why Low COGS % Is Incredibly Valuable
To understand why companies with a low COGS % are incredibly valuable, we need to understand the math behind how COGS translates to RoAS.
Let’s ask a simple question. Given a COGS %, what RoAS do you need to hit breakeven profitability?
We can start by modeling this as…
Ad Conversion Value – (Ad Conversion Value * pct_cogs) = Ad Spend
(Note: Ad Conversion value is simply “revenue” that’s tied back to ad spend. i.e. If you run $100 in ads and get $1,000 back, ad conversion value is $1,000)
With a bit of algebra, and knowing that RoAS is Ad Conversion Value / Ad Spend, we can obtain a formula for COGS:
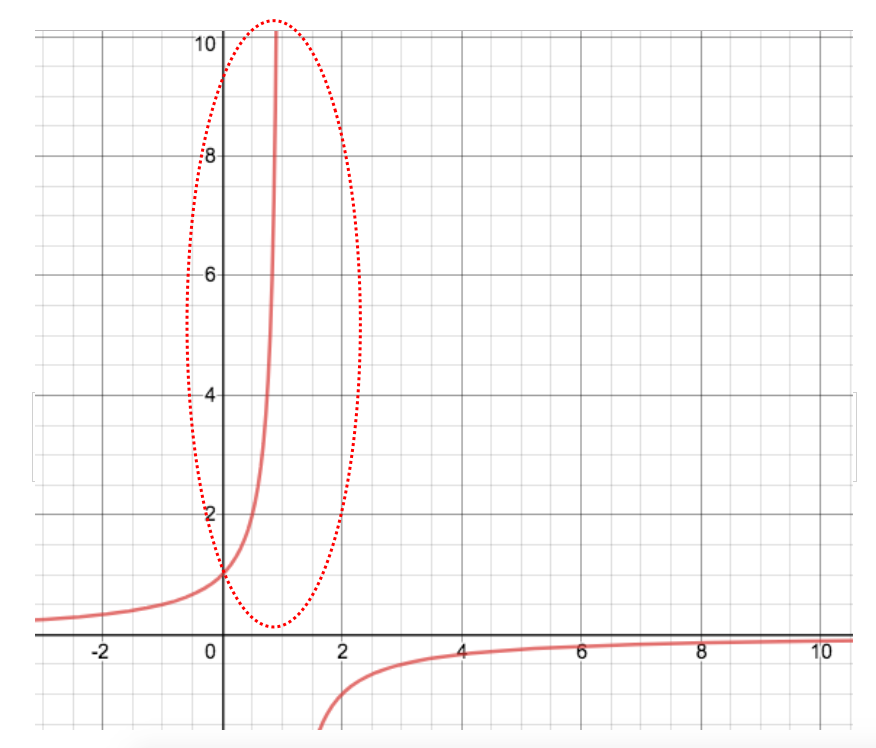
Breakeven RoAS = 1 / (1 – pct_cogs)
This means that, using the example above, if a company’s COGS is 20%, then breakeven RoAS is 1.25x. Note that because we are describing everything as a percentage, this is agnostic to absolute values.
The value behind a company with low COGS % exists subtly in the equation above, i.e. breakeven RoAS = 1/(1-x)
You may recall from calculus, that graph looks like this. 
We are obviously only concerned with the upper right quadrant here, i.e. the stuff that’s circled in red.
But the implication here is obvious–higher COGS requires an exponentially higher RoAS in order to hit breakeven. The difficulty and expense compound, because when it comes to acquisition, it becomes increasingly expensive to obtain a higher RoAS.
When we go through our final model, we’ll explain how COGS interacts with some of the other characteristics that make up the value of a D2C company.

